What’s the story of Mulembe in numbers?
We lift key population metrics from the preliminary report of the Kenya population census of 2019 to tell the story of Mulembe. Moreover, we also provide context through narrative touching on important past and present population events that might have shaped the numbers as we consume them today.
JUMP TO
| Bungoma County Population | Trans Nzoia County Population |
| Kakamega County Population | Vihiga County Population |
| Busia County Population |
MULEMBE IN NUMBERS: Vihiga County Population
Vihiga is the smallest county in Mulembe, both by population and area. It is home to the Mulembe houses of: Maragoli, Anyole and Tiriki. Further, it’s also home to the Terik whose umbilical cord is in Nandi. Historically it’s acknowledged that Vihiga is one the most heavily densely populated areas not only in Kenya but also the Great Lakes and Africa. This population pressure has occasioned out migration of brothers from these Mulembe houses to as far as Northern Tanzania.
As a result, there is a large diaspora population from the houses of Mulembe in modern day Vihiga. Most members of this ‘Mulembe diaspora’ are found in the counties of: Nairobi, Kisumu, Migori, Trans Nzoia, Bungoma, Uasin Gishu and Kakamega. The most recent evidence of existence of this ‘Mulembe diaspora’ is found in the unfortunate case of the October 10th, 2019 Chesumei evictions in Nandi county. In Kaptobongen village where the evictions took place, over 500 mulembe families were put out in the cold.
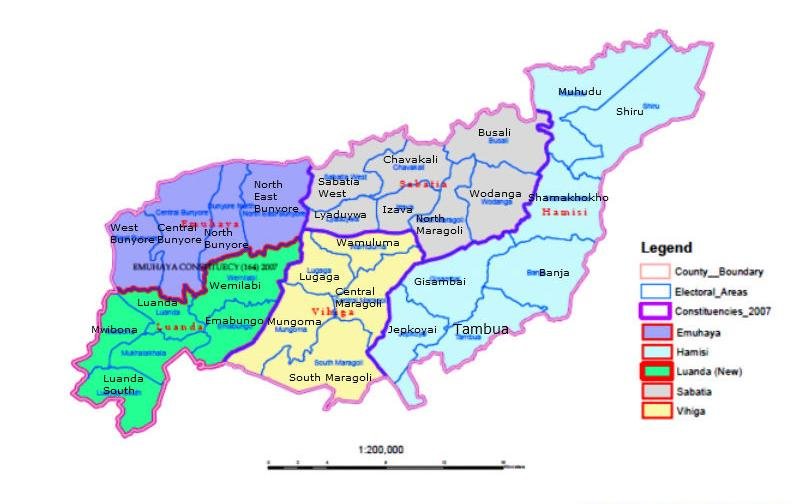
Major Towns and Urban Centers In Vihiga County
Vihiga county has a total area of 563.8 Sq. Km with a population density of 1047 persons per square kilometer. Major towns in Vihiga county include: Luanda, Mbale ( Vihiga County headquarters), Chavakali, Majengo, and the Kaimosi Complex that includes Cheptulu market.
Table Of Key Vihiga County Population Statistics As Per 2019 Census
The population of Vihiga county is 590,013 as per 2019 Kenya Census. Of whom there are 283,678 men, 306,323 female and intersex 12. The table below represents the breakdown per sub- county in Vihiga. It also provides data on the average household size in Vihiga, the land area in Sq.Km and the population density given as the number of people per Sq.Km.
| Sub-County | Male | Female | Intersex | Totals | Average Household Size | Population Density |
| Emuhaya | 46,507 | 50,633 | 1 | 97,141 | 4.1 | 1,091 (89.0) |
| Vihiga | 45,788 | 49,501 | 3 | 95,292 | 4.0 | 1,058 (90.1) |
| Sabatia | 62,944 | 68,683 | 1 | 131,628 | 4.2 | 1,181 (111.4) |
| Luanda | 51,525 | 55,165 | 4 | 106,694 | 3.9 | 1,265 (84.3) |
| Hamisi | 76,901 | 82,337 | 3 | 159,241 | 4.2 | 1,013 (157.2) |
| Kakamega Forest | 13 | 4 | … | 17 | 1.4 | 1 (31.7) |
| TOTALS | 283,678 | 306,323 | 12 | 590,013 |
Average household size in Vihiga county according to the 2019 census is 4.1. This excludes the special population (travellers, outdoor sleepers, individuals in hotels and lodges and persons in institutions).
MULEMBE IN NUMBERS: Bungoma County Population
Of the towns in mulembe whose potential for growth is high, given that they sprout at the intersection of major trade routes, our post on these Makutano towns revealed that Bungoma county had the lion share. This is by itself enough evidence of the recent demographic changes in what is now the 4th largest county by population in the republic.
Bungoma county is home to the Mulembe houses of: BaBukusu, Wanga and depending on the side you chose, the Tachoni. It is also home to groups that have been fully assimilated like the small Mulembe house of Batura, the Masaba from Uganda; and the more culturally distinct Saboat.
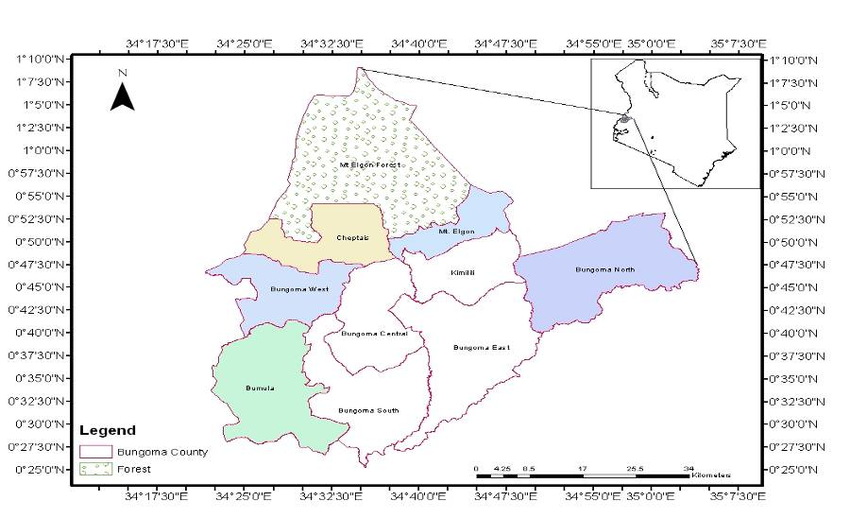
Major Towns and Urban Centers In Bungoma County
Bungoma county has a total area of 3023.9 Sq. Km with a population density of 552 persons per square kilometer. Major towns in Bungoma county include: Bungoma town (Bungoma County headquarters), Kimilili town, Bukembe Market, Kamukuywa market, Sang’alo market, Chwele market and Kibabii complex.
Table Of Key Bungoma County Population Statistics As Per 2019 Census
The population of Bungoma county is 1,670,570 as per 2019 Kenya Census. Of whom there are 812, 146 men, 858, 389 female and intersex 35. The table below represents the breakdown per sub- county in Bungoma. It also provides data on the average household size in Bungoma, the land area in Sq.Km and the population density given as the number of people per Sq.Km.
| Sub-County | Male | Female | Intersex | Total | Av. Household Size | Population Density (Land Area in Sq. Km) |
| Bumula | 103,368 | 112,525 | 1 | 215,892 | 4.8 | 625 (345.2) |
| Bungoma Central | 86,302 | 91,438 | 8 | 117,748 | 4.7 | 764 (232.7) |
| Bungoma East | 55,775 | 58,771 | 2 | 114,548 | 4.6 | 702 (163.3) |
| Bungoma North | 58,790 | 62,526 | 1 | 121,317 | 4.8 | 633 (191.5) |
| Bungoma South | 139,705 | 148,055 | 5 | 287,765 | 4.1 | 896 (321.2) |
| Cheptais | 67,717 | 68,312 | 6 | 136,035 | 5.2 | 610 (222.9) |
| Kimilili-Bungoma | 78,560 | 83,475 | 3 | 162,038 | 4.6 | 902 (179.6) |
| Mt. Elgon | 38,977 | 39,893 | 3 | 78,873 | 5.2 | 624 (126.5) |
| Bungoma West | 58,225 | 61,649 | 1 | 119,875 | 4.8 | 568 (211.0) |
| Tongaren | 48,685 | 51,657 | 1 | 100,343 | 4.7 | 542 (185.3) |
| Webuye West | 74,180 | 78,331 | 4 | 152,515 | 4.6 | 638 (238.9) |
| Mt. Elgon Forest | 1,862 | 1,759 | … | 3,621 | 4.5 | 6 (605.8) |
| TOTAL | 812, 146 | 858, 389 | 35 | 1,670,570 |
Average household size in Bungoma county according to the 2019 census is 4.6. This excludes the special population (travellers, outdoor sleepers, individuals in hotels and lodges and persons in institutions).
MULEMBE IN NUMBERS: Kakamega County Population
Kakamega county is home to what some have termed the central houses or oluyias of Mulembe Nation. They are: Batotso, Idakho, Isukha, Kabras, Wanga, Banyala ba Ndombi, Kisa and Marama. During the colonial period and before the promulgation of the Kenya constitution of 2010, Kakamega served as the headquarters of Mulembe Nation. It is in Kakamega that the infamous wizard Lukowa Titi from the Basombi clan of the BaBukusu performed a miracle where he made hailstones come down in order to get out of captivity by colonial administrators in Kakamega.
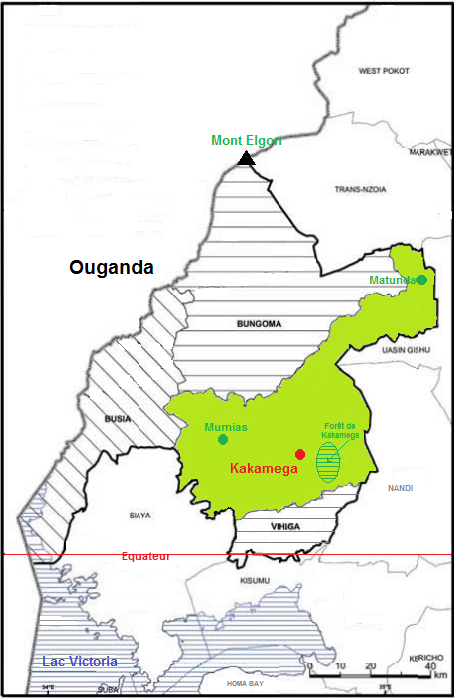
Major Towns and Urban Centers In Kakamega County
Kakamega county has a total area of 3020 Sq. Km with a population density of 618 persons per square kilometer. Major towns in Kakamega county include: Kakamega town (Kakamega County headquarters), Mumias town, Butere town, Sabatia market, Lubao market, Khayega market, Bukura complex and Malava town.
Table Of Key Kakamega County Population Statistics As Per 2019 Census
The population of Kakamega county is 1,867,579 as per 2019 Kenya Census. Of whom there are 897,133 men, 970,406 female and intersex 40. The table below represents the breakdown per sub- county in Kakamega. It also provides data on the average household size in Kakamega, the land area in Sq.Km and the population density as the number of people per Sq.Km.
| Sub-County | Male | Female | Intersex | Total | Av. Household Size | Population Density (Land Area in Sq. Km) |
| Butere | 73,634 | 80,463 | 3 | 154,100 | 4.2 | 734 (210.1) |
| Kakamega Central | 92,774 | 95,432 | 6 | 188,212 | 3.6 | 1,212 (155.2) |
| Kakamega East | 80,853 | 86,784 | 4 | 167,641 | 4.2 | 402 (417.2) |
| Kakamega North | 115,511 | 122,814 | 5 | 283,330 | 4.7 | 764 (146.2) |
| Kakamega South | 53,219 | 58,524 | … | 111,743 | 4.1 | 566 (420.8) |
| Khwisero | 53,670 | 59,803 | 3 | 113,476 | 4.1 | 780 (145.6) |
| Likuyani | 73,710 | 78,341 | 4 | 152,055 | 4.3 | 481 (316.1) |
| Lugari | 59,135 | 63,593 | … | 122,728 | 4.4 | 483 (254.3) |
| Matete | 31,749 | 34,423 | … | 66,172 | 4.7 | 644 (102.7) |
| Matungu | 78,793 | 88,143 | 4 | 166,940 | 4.6 | 598 (279.1) |
| Mumias East | 55,895 | 60,953 | 3 | 116,851 | 4.5 | 778 (150.2) |
| Mumias West | 54,915 | 60,438 | 1 | 115,354 | 4.1 | 706 (163.3) |
| Navakholo | 73,275 | 80,695 | 7 | 153,977 | 4.8 | 594 (259.3) |
| TOTALS | 897,133 | 970,406 | 40 | 1,867,579 |
Average household size in Kakamega county according to the 2019 census is 4.3. This excludes the special population (travellers, outdoor sleepers, individuals in hotels and lodges and persons in institutions).
MULEMBE IN NUMBERS: Busia County Population
The Mulembe houses from modern day Busia county, the BaKhayo, BaSamia and BaNyala, suffered most in the late 1890’s following the scramble and partition of Africa. Families were separated by imaginary lines that cut through bonds that had been nurtured through ages. These lines persist today as the boundary between Kenya and Uganda. Nonetheless, of all of Kenya’s border points, the Kenya- Uganda border should be the most fluid of all. This is because in spite of the eugenic aims behind creation of borders, families continue to live, commune and eat together.
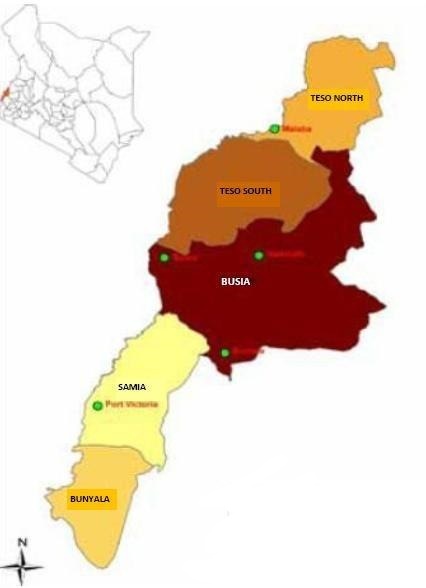
Major Towns and Urban Centers In Busia County
Busia county has a total area of 1696.3 Sq. Km with a population density of 527 persons per square kilometer. Major towns in Busia county include: Busia town (Busia County headquarters), Nambale town, Angorom market, Malaba town, Bumala market, Sio Port, Port Victoria, Mundika market, Butula market.
Table Of Key Busia County Population Statistics As Per 2019 Census
The population of Busia county is 893,681 as per 2019 Kenya Census. Of whom there are 426,252 men, 467,401 female and intersex 28. The table below represents the breakdown per sub- county in Busia. It also provides data on the average household size in Busia, the land area in Sq.Km and the population density as the number of people per Sq.Km.
| Sub-County | Male | Female | Intersex | Totals | Av. Household Size | Population Density (Land Area in Sq. Km) |
| Bunyala | 41,465 | 44,511 | 1 | 85,977 | 4.5 | 447 (192.2) |
| Busia | 69,034 | 73,373 | 1 | 142,408 | 4.2 | 727 (196.0) |
| Butula | 65,136 | 75,195 | 3 | 140,334 | 4.3 | 576 (243.6) |
| Nambale | 52,900 | 58,732 | 4 | 111,636 | 4.7 | 469 (238.1) |
| Samia | 50,821 | 56,341 | 14 | 107,176 | 4.5 | 408 (262.4) |
| Teso North | 66,412 | 71,619 | 3 | 103,034 | 4.7 | 529 (261.0) |
| Teso South | 80,484 | 87,630 | 2 | 168,116 | 4.6 | 555 (302.9) |
| TOTALS | 426,252 | 467,401 | 28 | 893,681 |
Average household size in Busia county according to the 2019 census is 4.5. This excludes the special population (travellers, outdoor sleepers, individuals in hotels and lodges and persons in institutions).
MULEMBE IN NUMBERS: Trans Nzoia County Population
Traditionally, Trans Nzoia county is listed among the North Rift counties of Kenya. Although this county that’s often termed as the bread basket of Kenya is cosmopolitan, a majority of its inhabitants are from the Mulembe house of BaBukusu. It is for this reason, and the undeniable cultural imprint of Bukusu culture in the persona of this county, that we list it among Mulembe counties.
Consider for instance the hit song ‘Muliro’ by the late Bukusu music maestro Isaac Kisache. In this dirge, Kisache mourns the legend of Mulembe hero Masinde Muliro. In particular, he his thankful for Muliro’s role in conquering ‘Forkland’ thus facilitating the migration of Babukusu into Trans Nzoia.
Major Towns and Urban Centers In Trans Nzoia County
Trans Nzoia county has a total area of 2,495.2 Sq. Km with a population density of 397 persons per square kilometer. Major towns in Trans Nzoia county include: Kitale Town (Trans Nzoia County headquarters), Maili Nane Market, Endebess market, Matisi market, Kiminini town and Maili Saba market along the Kitale-Eldoret highway.
Table Of Key Trans Nzoia County Population Statistics As Per 2019 Census
The population of Trans Nzoia county is 893,681 as per 2019 Kenya Census. Of whom there are 426,252 men, 467,401 female and intersex 28. The table below represents the breakdown per sub- county in Trans Nzoia. It also provides data on the average household size in Trans Nzoia, the land area in Sq.Km and the population density as the number of people per Sq.Km.
| Constituency | Male | Female | Intersex | Total | Av. Household Size | Population Density (Land Area in Sq. Km) |
| Trans Nzoia West | 101,198 | 101,174 | 5 | 202,377 | 4.2 | 569 (355.4) |
| Trans Nzoia East | 113,498 | 116,029 | 11 | 229,538 | 4.6 | 365 (629.1) |
| Kwanza | 100,234 | 103,584 | 3 | 203,821 | 4.4 | 438 (465.3) |
| Endebess | 56,090 | 55,689 | 3 | 111,782 | 4.7 | 165 (678.4) |
| Kiminini | 118,087 | 124,730 | 6 | 242,823 | 4.3 | 662 (366.9) |
| TOTALS | 489,107 | 501,206 | 28 | 990,341 |
Average household size in Trans Nzoia county according to the 2019 census is 4.4. This excludes the special population (travellers, outdoor sleepers, individuals in hotels and lodges and persons in institutions).